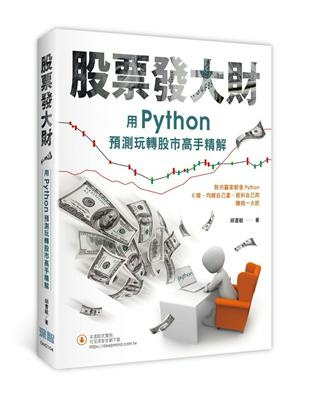
用Python預測玩轉股市高手精解+Python數據可視化之matplotlib實踐(胡書敏,劉大成)
基本上這種工具書是寫不了心得,因為你必須真的用了才行.所以這裡就以兩個實作替代,並提示一些在實作上遇到的關鍵問題所在..實作一的目標是建立一個台灣股市加權指數"每5秒委託成交統計"資料庫."每5秒委託成交統計"的日資料可以在證交所網站找到https://www.twse.com.tw/zh/page/trading/exchange/MI_5MINS.html,它是一張日報表,交易所提供這項資料是從2004/10/15開始,而我們的目標就是要將自2004/10/15到今天為止所有的資料都透過爬蟲與下載的方式抓回到自己的電腦上,並將其建立成資料庫.
首先須釐清資料庫可能的大小,交易所在2004/10/15開始提供此項資料時,是以"每分鐘委託成交統計"開始,所以每日的資料從9:00到13:30共270分鐘,所以有271筆,但到了2011/1/16開始轉為""每15秒委託成交統計,所以單日的資料筆數增到1081筆,2014/02/23後改為每10秒,日資料筆變為1622筆,到了2015/1/1起正式改為每5秒揭露,日資料筆增為3241筆,若一年以240個交易日為平均,一年將會有78萬筆資料,所以採用資料庫是比較有利的蒐集資料的做法,因為交易所的資料只提供html與csv兩種形式,在處理單一交易日上或許簡便,要整體拿來用就麻煩多了.
回到證交所網站"每5秒委託成交統計"頁面來看,它只提供使用者以下拉式選單變更日期來進行查詢,並以左上邊提供了"HTML"與"CSV下載"將資料下載回自己電腦,但是若想用人力在電腦上一張張下載回來這也未免太累,這種重複性的機械動作,使用程式代勞是較好的.以2021/08/31為例,看一下html,它的網址是(https://www.twse.com.tw/exchangeReport/MI_5MINS?response=html&date=20210831,你可以在該頁面上按滑鼠右鍵,選擇另存新檔,這樣資料就下載完成,或是將上述網址中的"?response=html"這這段中的html改為csv,即"https://www.twse.com.tw/exchangeReport/MI_5MINS?response=csv&date=20210831",就能下載該資料的csv檔,既然此我們何不透過利用程式調整這網址的date=20210831從date=2004/10/15一路到今天,這樣便能將所有交易日的csv檔給下載回來.python程式簡單結構如下:
from selenium import webdriver
from time import sleep
urltemp = 'https://www.twse.com.tw/exchangeReport/MI_5MINS?response=csv&date='
browser = webdriver.Chrome()
browser.maximize_window()
sleep(30)
yeartemp=""
monthtemp=""
daytemp=""
downtemp=""
url="" spa=" "
for i in range(2004,2022):
for j in range(1,13):
for k in range(1,32):
product = i * j * k
yeartemp=str(i)
monthtemp=str(j)
daytemp=str(k)
if monthtemp=="1" : monthtemp="01"
if monthtemp=="2" : monthtemp="02"
if monthtemp=="3" : monthtemp="03"
if monthtemp=="4" : monthtemp="04"
if monthtemp=="5" : monthtemp="05"
if monthtemp=="6" : monthtemp="06"
if monthtemp=="7" : monthtemp="07"
if monthtemp=="8" : monthtemp="08"
if monthtemp=="9" : monthtemp="09"
if daytemp=="1" : daytemp="01"
if daytemp=="2" : daytemp="02"
if daytemp=="3" : daytemp="03"
if daytemp=="4" : daytemp="04"
if daytemp=="5" : daytemp="05"
if daytemp=="6" : daytemp="06"
if daytemp=="7" : daytemp="07"
if daytemp=="8" : daytemp="08"
if daytemp=="9" : daytemp="09"
downtemp= yeartemp+monthtemp+daytemp
url=urltemp+downtemp
print("%2s" % (url), end=" ")
browser.get(url)
sleep(4) .
這裡有一個小問題,就是有些日期非交易日,無資料,我在這裡並沒有處理,這是因為無資料的日期,證交所網站會下載的是執行此程式當天的csv,並不會出現任何其他訊息,所以乾脆忽略,因為這程式的目的只是要蒐集所有的"委託成交統計"csv檔,不需要計較輸出的型態.執行完畢後我們便能拿到乞今為止所有委託成交統計的csv,但這只是一堆雜亂無序的csv,要維護它太麻煩,所以我們將它全部匯入資料庫中.
匯入資料庫,首先須選用哪種資料庫,可以是MS-SQL,可以是MYSQL,我們這裡使用的是Sqlite.其次檢視一下單一交易日的csv檔,會發現它有個煩人的問題,每張csv表有日期的表頭,加上有一個9列的表尾附註,而這是我們不要放進資料庫裡的東西.同陽的困擾,若我們採用手動匯入csv檔到資料庫未免太累,想想240交易日*17年,要匯入3360個csv檔,而且每一張csv你還得修正表頭與表尾,那不如就寫段程式讀入,程式碼如下:
import os.path
import pandas as pd
import sqlite3 conn = sqlite3.connect('twse5minall.sqlite') # 建立資料庫連線
cursor = conn.cursor() # 建立 cursor 物件 # 建立一個資料表
sqlstr='CREATE TABLE IF NOT EXISTS table1 \ ("num" INTEGER PRIMARY KEY NOT NULL ,"tel" TEXT)'
cursor.execute(sqlstr)
yeartemp=""
monthtemp=""
daytemp=""
downtemp=""
url=""
spa=" "
temp=""
sqlstr=""
mintemphead="c:/users/user/downloads/MI_5MINS_"
mintemptail='.csv'
total=0
dayno=0
for i in range(2004,2022):
for j in range(1,13):
for k in range(1,32):
product = i * j * k
#print("%d*%d*%d=%-2d " % (i, j, k, product), end="")
yeartemp=str(i)
monthtemp=str(j)
daytemp=str(k)
if monthtemp=="1" : monthtemp="01"
if monthtemp=="2" : monthtemp="02"
if monthtemp=="3" : monthtemp="03"
if monthtemp=="4" : monthtemp="04"
if monthtemp=="5" : monthtemp="05"
if monthtemp=="6" : monthtemp="06"
if monthtemp=="7" : monthtemp="07"
if monthtemp=="8" : monthtemp="08"
if monthtemp=="9" : monthtemp="09"
if daytemp=="1" : daytemp="01"
if daytemp=="2" : daytemp="02"
if daytemp=="3" : daytemp="03"
if daytemp=="4" : daytemp="04"
if daytemp=="5" : daytemp="05"
if daytemp=="6" : daytemp="06"
if daytemp=="7" : daytemp="07"
if daytemp=="8" : daytemp="08"
if daytemp=="9" : daytemp="09"
temp=yeartemp+'/'+monthtemp+'/'+daytemp
downtemp= yeartemp+monthtemp+daytemp
total=int(downtemp)
#print(total)
if total>20151001 : dayno=3242
if (total<20150101 and="" total="">20140421) : dayno=1622
if (total<20140224 and="" total="">20110930) : dayno=1082
if (total<20110117 and="" total="">20071128) : dayno=272
#print(dayno)
url=mintemphead+downtemp+mintemptail
print("%2s" % (url), end=" ")
if os.path.exists(url):
df=pd.read_csv(url,encoding='big5',parse_dates=True)
m=1
print(temp+"檔案存在")
print(str(total)+"--"+str(dayno))
while m<dayno:
a=df.index[m][0]
b=df.index[m][1]
c=df.index[m][2]
d=df.index[m][3]
e=df.index[m][4]
f=df.index[m][5]
g=df.index[m][6]
h=df.index[m][7]
sqlstr="insert into table1 values ('{}','{}','{}','{}','{}','{}','{}','{}','{}')".format(temp,a,b,c,d,e,f,g,h)
cursor.execute(sqlstr)
conn.commit() # 主動更新
m=m+1
else:
print(temp+"檔案不存在", end=" ")
conn.close() :
這程式就分別了沒有交易日的資料就不處理的問題,其中留心原證交所的日資料是8欄,我們寫入資料庫時增加了一欄日期欄,成了9欄.但是光是如此只是將原資料insert資料庫是不夠的,因為原始資料是累積資料即 09:03:00的資料是從09:00:00到09:03:00的累積,而我們需要的是一單位內的資料,從早期每分鐘的增量,到近期每5秒的增量,不是累積量.所以我又寫如下的程式碼:
import os.path
import pandas as pd
import sqlite3
import locale
locale.setlocale(locale.LC_ALL, 'en_US.UTF-8')
conn = sqlite3.connect('twse5min2011test.sqlite') # 建立資料庫連線
sqlstr="SELECT * from table1 '"
cursor=conn.execute(sqlstr) #cursor.commit()
temp=''
temp1=''
daytemp=''
daytemp1=''
dayint=0
tempchtime=''
rows=cursor.fetchall
i=0
a=0.0
b=0.0
c=0.0
d=0.0
e=0.0
f=0.0
g=0.0
tempa=0
tempb=0
tempc=0
tempd=0
tempe=0
tempf=0
tempg=0
dconn = sqlite3.connect('div2011.sqlite')
dcursor = dconn.cursor()
dsqlstr='CREATE TABLE IF NOT EXISTS table1 \ ("d1" INTEGER PRIMARY KEY NOT NULL ,"tel" TEXT)'
dcursor.execute(dsqlstr)
daytemp=""
daytemp1=''
yeartemp=""
monthtemp=""
atemp=""
strtemp=""
for y in range(2004,2022):
for m in range(1,13):
for d in range(1,32):
#product = i * j * k
#print("%d*%d*%d=%-2d " % (i, j, k, product), end="")
yeartemp=str(y)
monthtemp=str(m)
datetemp=str(d)
if monthtemp=="1" : monthtemp="01"
if monthtemp=="2" : monthtemp="02"
if monthtemp=="3" : monthtemp="03"
if monthtemp=="4" : monthtemp="04"
if monthtemp=="5" : monthtemp="05"
if monthtemp=="6" : monthtemp="06"
if monthtemp=="7" : monthtemp="07"
if monthtemp=="8" : monthtemp="08"
if monthtemp=="9" : monthtemp="09"
if datetemp=="1" : datetemp="01"
if datetemp=="2" : datetemp="02"
if datetemp=="3" : datetemp="03"
if datetemp=="4" : datetemp="04"
if datetemp=="5" : datetemp="05"
if datetemp=="6" : datetemp="06"
if datetemp=="7" : datetemp="07"
if datetemp=="8" : datetemp="08"
if datetemp=="9" : datetemp="09"
atemp=yeartemp+'/'+monthtemp+'/'+datetemp
downtemp= yeartemp+monthtemp+datetemp
total=int(downtemp)
if total>20151001 : dayno=3242
if (total<20150101 and="" total="">20140421) : dayno=1622
if (total<20140224 and="" total="">20110930) : dayno=1082
if (total<20110117 and="" total="">20070717) :
strtemp= "SELECT * FROM table1 WHERE day='"+str(atemp)+"' "
#print(strtemp)
us_df = pd.read_sql(strtemp, conn)
#print(us_df)
if us_df.index.values !='[]' :
for i in range(0,271):
if i==0:
daytemp=us_df.loc[i]["day"]
daytemp1=daytemp[0:4]+"-"+daytemp[5:7]+"-"+daytemp[8:10]
tempa= locale.atof(us_df.loc[0]["num1"])
tempb= locale.atof(us_df.loc[0]["num2"])
tempc= locale.atof(us_df.loc[0]["num3"])
tempd= locale.atof(us_df.loc[0]["num4"])
tempe= locale.atof(us_df.loc[0]["num5"])
tempf= locale.atof(us_df.loc[0]["num6"])
tempg= locale.atof(us_df.loc[0]["num7"])
dsqlstr=" insert into table1 values ('{}','{}',{},{},{},{},{},{},{})".format(daytemp1,us_df.loc[i]["time"],tempa,tempb,tempc,tempd,tempe,tempf,tempg)
dcursor.execute(dsqlstr)
dconn.commit() # 主動更新
else:
daytemp=us_df.loc[i]["day"]
daytemp1=daytemp[0:4]+"-"+daytemp[5:7]+"-"+daytemp[8:10]
tempa=locale.atof(us_df.loc[i]["num1"])-locale.atof(us_df.loc[i-1]["num1"])
tempb=locale.atof(us_df.loc[i]["num2"])-locale.atof(us_df.loc[i-1]["num2"])
tempc=locale.atof(us_df.loc[i]["num3"])-locale.atof(us_df.loc[i-1]["num3"])
tempd=locale.atof(us_df.loc[i]["num4"])-locale.atof(us_df.loc[i-1]["num4"])
tempe=locale.atof(us_df.loc[i]["num5"])-locale.atof(us_df.loc[i-1]["num5"])
tempf=locale.atof(us_df.loc[i]["num6"])-locale.atof(us_df.loc[i-1]["num6"])
tempg=locale.atof(us_df.loc[i]["num7"])-locale.atof(us_df.loc[i-1]["num7"])
dsqlstr=" insert into table1 values ('{}','{}',{},{},{},{},{},{},{})".format(daytemp1,us_df.loc[i]["time"],tempa,tempb,tempc,tempd,tempe,tempf,tempg)
dcursor.execute(dsqlstr)
dconn.commit()
i=i+1
dconn.close() # 關閉資料庫 ,.
經過以上的程式碼處理,我們得出以下的資料庫:
這資料庫超過500萬筆,看起來很大,其實就大數據來說並不多,當然這資料我們後續還有其他用處.
接著我們做實作二,這個比較簡單,匯入2000到2021年台股期貨指數每分鐘的交易資料,並畫出它的k線圖,注意是每分鐘的.期指資料室從網上找來的,它也是csv檔,但結構簡單,一共3檔案,直接用sqlite中import即可,但這裡有一個問題.而這事涉在python中畫k線圖,問題就在Datetime的設定,早期想在python中畫k團使用的是mpl_finane這個套件,只要安裝pip install mpl_finance然後在實際的程式中import即可,但這個套件已經3,4年無人維護,以至於它被放棄了,目前新的套件是mplfinace,差別在沒有底線連接,但這個畫k線的方式與mpl_finance不同,其實比較直觀,簡單,但是它有一個資料結構的要求如果你畫的是日線圖,它腰的資料結構是 date open high low close volue,這6個欄位,其中date默認的日期結構是 xxxx-xx-xx,即如2021-08-31,你要是原始資料的時間結構不是這種的,執行程式畫k現時,會回報資料錯誤,比如2021/08/31就不能用,而若畫的是分鐘線,默認的資料結構是 xxxx-xx-xx **:**:**,即如 2021-08-31 09:00:00,這盎的型態.我們從網上找的資料並不是這種,所以我們在程式碼裡先修正後,然後用datetime的方法重新宣告後,再用mplfinace中的plot將k線圖畫出,程式碼如下:
import time
import pandas as pd
import matplotlib
import mplfinance as mpf
import matplotlib.pyplot as plt
import sqlite3
import datetime
import abstract
strtemp=""
str1=""
str3=""
str2=""
i=0
iday = []
conn = sqlite3.connect('indexfuturecom.sqlite') # 建立資料庫連線 0
strtemp= "select * from table1"
df = pd.read_sql(strtemp,conn,parse_dates=True)
df['Date'] = pd.to_datetime(df['Date'])
df.set_index('Date', inplace=True)
iday=df.loc['2001-01-02 08:46:00':'2021-07-31 13:45:00',:]
kwargs=dict(title='Candle plot',figratio=(15,10),figscale=5) mc=mpf.make_marketcolors(up='red',down='green',edge='i',wick='i',volume='in',inherit=True) s=mpf.make_mpf_style(gridaxis='both',gridstyle='-.',y_on_right=False,marketcolors=mc)
#print(iday)
mpf.plot(iday,**kwargs,type='candle',style =s,volume=True,addplot=[])
plt.show() ..,
經過以上的執行,繪出的k線圖如下:
這裡面需要強調,畫出k線需要與python中的matplotlib的plot來搭配使用,這裡面可以用的功能較多,而"Python數據可視化之matplotlib實踐"這本書將這些講當相對簡單清楚,其中的程式碼從電子書copy進去Juputer執行可你說都沒問題,可以花個一天了解清楚.搭配上提供Python Guit程式的Tkinter套件裡的Canvas等繪圖功能,應該能完全提供給想要自製AI程式自動交易者的需求,畢竟都已經在Python中了,下來是要import Sklearn,Tensorflow,做成回歸.或SVM或是像我有其它的需求應該都是比較方便的.在這次的兩本書中"用Python預測玩轉股市高手精解"寫了許多如何從原始資料取得開始建立自己的交易系統的內容 可惜的是它用的多是對岸股市資料,本地的讀者可能需要自行找尋自己需要的部分,不過在資料結構,繪圖,系統指標的建立,到資料庫都有一些探索,是值得python有些基礎的人來看,唯其中的畫k線,它是用舊的mpl_finance,是無法使用的,想用新的mplfinace套件的可以參考網站"https://github.com/matplotlib/mplfinance"有相對較多的說明,而想配合發展Python Gui的可以參考Tkinter或PYQT5的專書,這本"用Python預測玩轉股市高手精解"雖有討論了TKinter的範例都內容不多,以上大概就是這兩本書使用下,透過實作台股資訊的兩個案例.以上. "此處的程式碼都是在下用最粗略直觀的方式是寫出來的,並沒有事前計畫,更未考慮效率與簡潔,主要都只是為產生可以供後續使用的原始資料,因此並不建議任何人取用它來工作,因為雖然程式碼都不長,但需要執行的時間都很久,這是必須說明的"
這裡有"Python數據可視化之matplotlib實踐的全部內容的epub檔"matplotlib實踐
接下來就用Tkinter寫一個GUI將以上的K線圖包裝進去:
import time
import pandas as pd
import matplotlib
import mplfinance as mpf
import matplotlib.pyplot as plt
import sqlite3
import datetime
import abstract
import numpy as np
from matplotlib.backends.backend_tkagg import FigureCanvasTkAgg F
from tkinter import *
import tkinter as tk
win=tk.Tk()
win.geometry("850x750")
strtemp=""
str1=""
str3=""
str2=""
i=0
iday = []
conn = sqlite3.connect('indexfuturecom.sqlite')
strtemp= "select * from table1"
df = pd.read_sql(strtemp,conn,parse_dates=True)
df['Date'] = pd.to_datetime(df['Date'])
df.set_index('Date', inplace=True)
iday=df.loc['2001-01-02 08:46:00':'2021-07-31 13:45:00',:]
fig = mpf.figure()
chart_canvas=tk.Canvas(win,background='white',width=600,height=200)
kwargs=dict(title='Candle plot',figratio=(3,2),figscale=5) mc=mpf.make_marketcolors(up='red',down='green',edge='i',wick='i',volume='in',inherit=True) s=mpf.make_mpf_style(gridaxis='both',gridstyle='-.',y_on_right=False,marketcolors=mc) fig,ax=mpf.plot(iday,type='candle',tight_layout=True,style=s, volume=True,returnfig = True)
chart_canvas = FigureCanvasTkAgg(fig,master=win)
chart_canvas.draw()
chart_canvas.get_tk_widget().place(relx = .01, rely=.05)
win.mainloop()
以上面的數據來跑簡單的SVM程式碼如下:
import time
import pandas as pd
import matplotlib
import mplfinance as mpf
import matplotlib.pyplot as plt
import sqlite3
import datetime
import abstract
import numpy as np
from matplotlib.backends.backend_tkagg import FigureCanvasTkAgg
from tkinter import *
import tkinter as tk
import math
from sklearn import svm,preprocessing
import dataframe
strtemp=""
i=0
iday = []
iday1 = []
conn = sqlite3.connect('indexfuturecom.sqlite') # 建立資料庫連線
strtemp= "select * from table1"
origDF = pd.read_sql(strtemp,conn,parse_dates=True)
origDF['Date'] = pd.to_datetime(origDF['Date'])
origDF.set_index('Date', inplace=True)
iday=origDF.loc['2001-01-02 08:46:00':'2021-07-31 13:45:00',:]
iday['diff'] = iday["Close"]-iday["Close"].shift(1)
iday['diff'].fillna(0,inplace=True)
iday['up'] = iday['diff']
iday['up'][iday['diff']>0] = 1
iday['up'][iday['diff']<=0] = 0
iday['predictForUp'] = 0
target = iday['up']
length=len(iday)
trainNum=int(length*0.8)
predictnum=length-trainNum
feature=iday[['Close','High','Low','Open','Volume']]
feature=preprocessing.scale(feature)
featuretrain=feature[0:trainNum]
targettrain=target[0:trainNum]
svmTool=svm.SVC(kernel='linear')
svmTool.fit(featuretrain,targettrain)
predictedIndex=trainNum
while predictedIndex < length :
testfeature=feature[predictedIndex:predictedIndex+1]
predictForup=svmTool.predict(testfeature)
iday.iloc[predictedIndex]['predictForUp']=predictForup
predictedIndex = predictedIndex+1
dfwithpredicted = iday[trainNum:length]
figure=plt.figure()
(axClose,axUpordown) = figure.subplots(2, sharex=True)
dfwithpredicted['Close'].plot(ax=axClose)
dfwithpredicted['predictForUp'].plot(ax=axUpordown,color="red",label='predicted data') dfwithpredicted['up'].plot(ax=axUpordown,color="blue",label='real data')
plt.legend(loc='best')
plt.xticks()
plt.setp(plt.gca().get_xticklabels(), rotation=30)
plt.title("透過SVM預測期指漲跌情況")
plt.rcParams['font.sans-serif']=['SimHei']
plt.show()


 留言列表
留言列表
